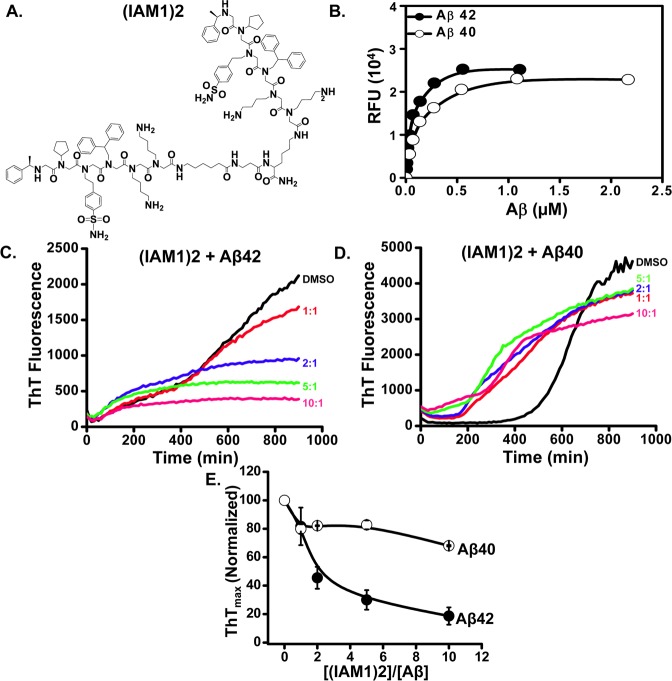
Figure 4.
Evaluation of the dimeric derivative (IAM1)2. (A) Chemical structure of the dimeric derivative (IAM1)2. (B) The binding curves of (IAM1)2 with Aβ42 and Aβ40 using fluorescence solid phase binding assay. The average fluorescence reading at each Aβ concentration is shown as mean ± SE (n = 3). The average fluorescence data were fitted with a nonlinear regression curve using one site binding equation. (C, D) Time courses of the fluorescence of aggregate-bound ThT in the aggregation processes of Aβ42 (C) or Aβ40 (D) in the presence of (IAM1)2 at different concentrations. Molar ratio of (IAM1)2:Aβ in the range from 1:1 to 10:1 as indicated. (E) The normalized ThTmax values for the aggregation processes of Aβ42 and Aβ40 is plotted as a function of (IAM1)2 concentration. The data in each aggregation experiment were normalized to ThTmax value obtained in the presence of DMSO, averaged and shown as mean ± SEM (n = 3).

