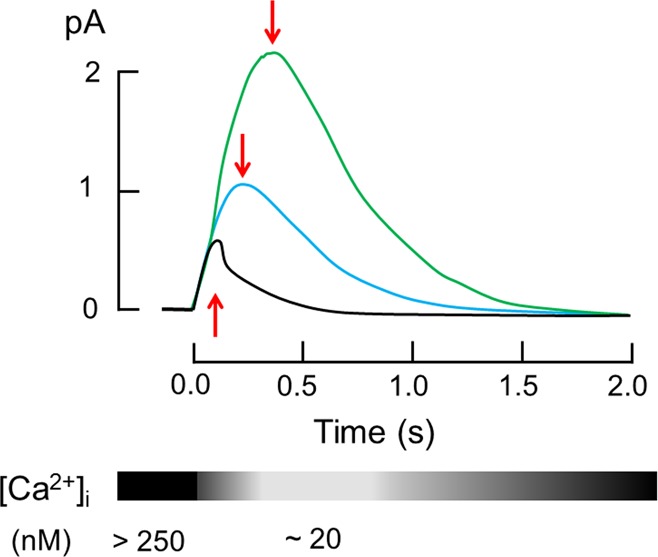
Figure 1.

Idealized single photon responses of mice rods. Responses of rods from wild-type mice (black trace), from GCAPs–/– mice (green trace), and from mice expressing GCAP2 on a GCAPs–/– genetic background (blue trace) were superimposed. Red arrows indicate the time at which maximum amplitude is reached (time-to-peak). Traces represent typical idealized responses and were drawn according to published results in ref (15). The lower part of the figure shows the change of intracellular Ca2+-concentration during a light response.
