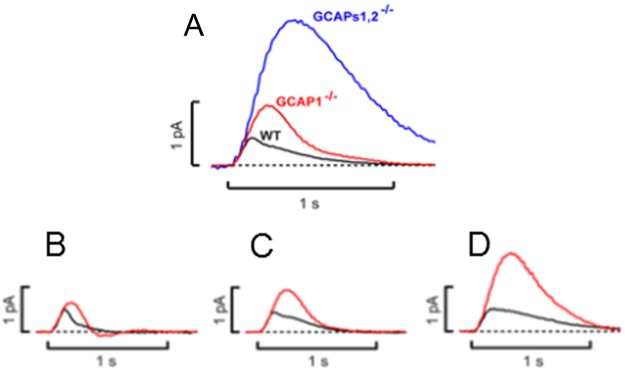
Figure 2.

Heterogeneity of light responses from WT and transgenic mice. Original recordings were adapted from Figure 6 of ref (21) (Makino et al., PLoS One 7, e47637) in accordance with the Creative Commons Attribution License. (A) Comparison of averaged dim flash recordings from WT, GCAP1–/–, and GCAPs1,2–/– as indicated. (B–D) Variability of integration times of single photon responses as observed by Makino et al.21
