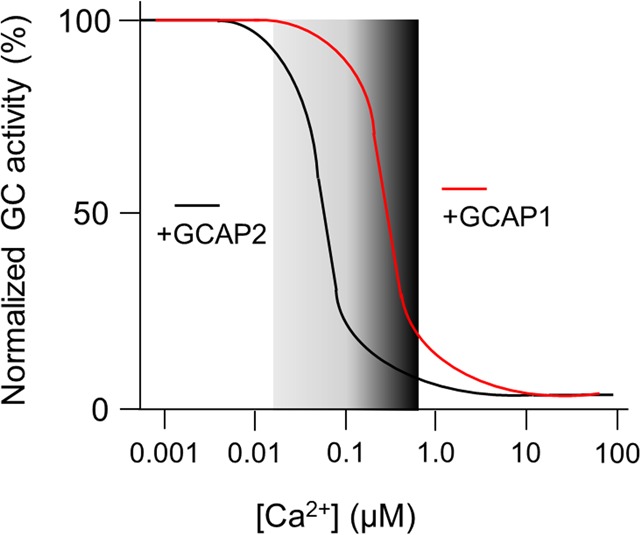
Figure 3.

Ca2+-dependent activation profile of the photoreceptor guanylate cyclase is regulated by GCAP1 and GCAP2. The GC activity is normalized to 100%. The curves are typical for mammalian GCAPs and summarize the principal finding of many references (see main text). The gray bar symbolizes the physiological range of cytoplasmic Ca2+ that changes from a high (dark gray) to a low value (light gray).
