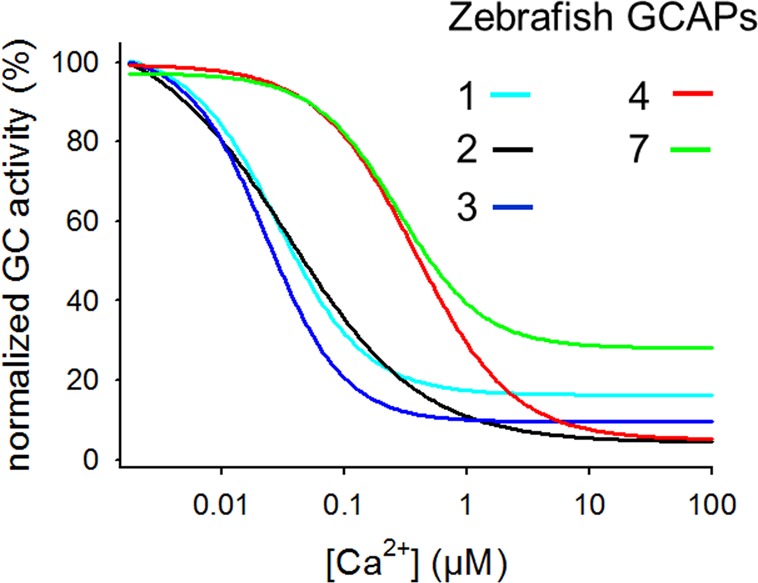
Figure 4.

Activity profiles of cone specific GCAPs from zebrafish. The GC activity is normalized as in Figure 3. The curves were obtained by measuring the GC activity in the presence of zGCAPs as indicated. The figure is based on the original data published in ref (53), where a bovine ROS membrane preparation containing ROS-GCs was used for assaying zebrafish GCAPs.
