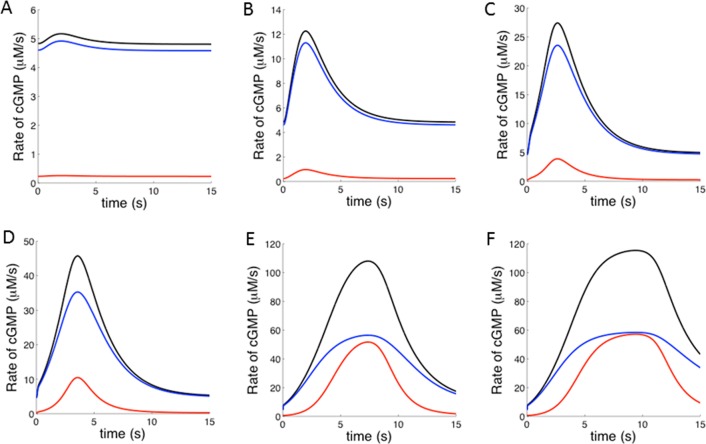
Figure 7.
Simulated time course of the synthesis of cGMP by GC1 under the Ca2+-mediated regulation by GCAP1 and GCAP2 according to the Ca2+-relay mechanism. Panels A–F refer to the same flashes of increasing intensity reported in Figure 6 (i.e., panel A refers to 1.54 photoisomerization, panel B to 46 photoisomerizations, and so forth). Blue lines report on the contribution of GCAP1 to the rate of synthesis, while red lines to that of GCAP2. The two contributions add up to form the overall rate (black line).

