Figure 8.
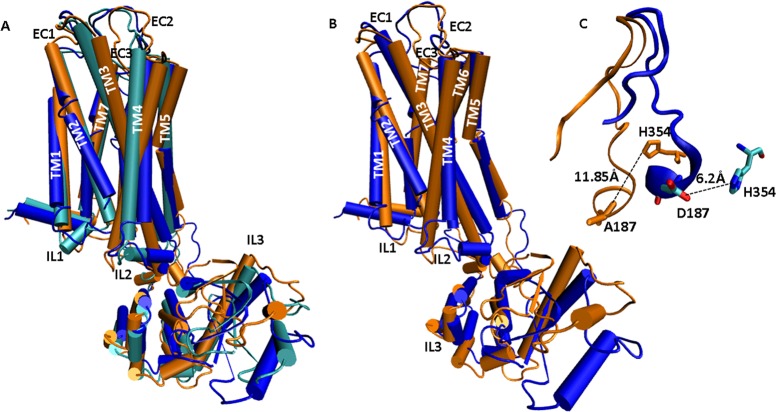
Structural superpositioning of various D3 receptor models represented as cartoon models detailing structural changes involved in tolerance-inducing versus noninducing conformations. (A) Superpositioning of PD128907-activated, wild type D3 receptor (cyan), D3 C147K mutant receptor (blue), and D3 D187A mutant receptor (orange). PD128907 induces tolerance in the wild type D3 and D3 C147K mutant receptors but not in the D3 D187A mutant receptor. (B) Structural superpositioning of PD128907-activated D3-C147K mutant receptor (blue) and D3-D187A mutant receptor (orange) show that a majority of conformational changes are in the domain formed by IL2-TM4-EC2-TM5-IL3. (C) Close-up view of the superposed EC2 loop in PD128907-activated D3-D187A mutant (orange) and D3-C147K mutant (blue) shows that a salt bridge is formed between D187 and H354 which could be an indicator of tolerance-inducing conformations. The residues D187 and H354 from D3-C147K model are shown as licorice sticks and colored atom type; C= cyan, N = blue, O = red. A187 and H354 from D3-D187A model are represented by orange licorice sticks.

