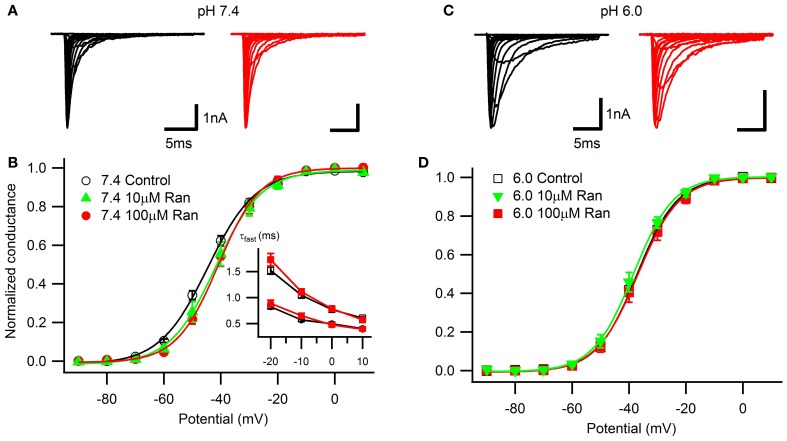
Figure 1.
Voltage-dependence of activation and open-state inactivation time constants. Representative currents in response to 20 ms depolarizations in 10 mV steps from −130 mV at extracellular pH 7.4 (A) and 6.0 (C) in drug-free conditions (black) and with 100 μM ranolazine (red). (B) Conductance-voltage relationships at pH 7.4 in control (open black circles), 10 μM ranolazine (solid green triangles), and 100 μM ranolazine (solid red circles). (D) Conductance-voltage relationships at pH 6.0 in control (open black squares), 10 μM ranolazine (solid green triangles), and 100 μM ranolazine (solid red squares). Fit parameters are summarized in Table A1. (B, inset) Time constants of open-state inactivation were obtained by fitting current decay with a single exponential function in control (open black symbols) and with 100 μM ranolazine (solid red symbols) at pH 7.4 (circles) and 6.0 (squares). Time constants are reported in Table A2.

