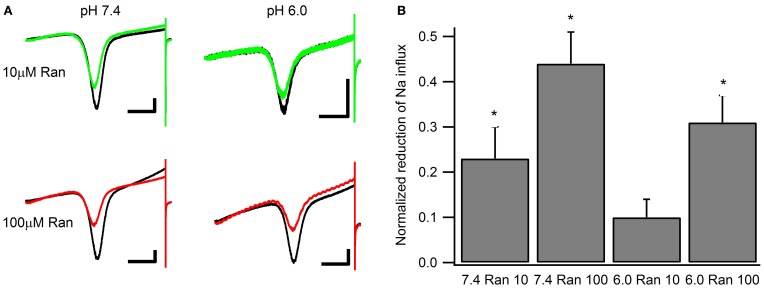
Figure 7.
Window currents measured with 500 ms ramps (0.3 mV/ms) from −130 to +20 mV. (A) Representative matched pairs before and after perfusion of either 10 μM ranolazine (top) or 100 μM ranolazine (bottom). Scale bars are 100 ms and 50 pA. (B) Total charge flow was calculated by integrating current traces after subtracting the linear leak component. Charge for every cell was then normalized to that in the absence of ranolazine and plotted as a function of drug and pH. Statistically significant reductions in charge influx are indicated with asterisks.

