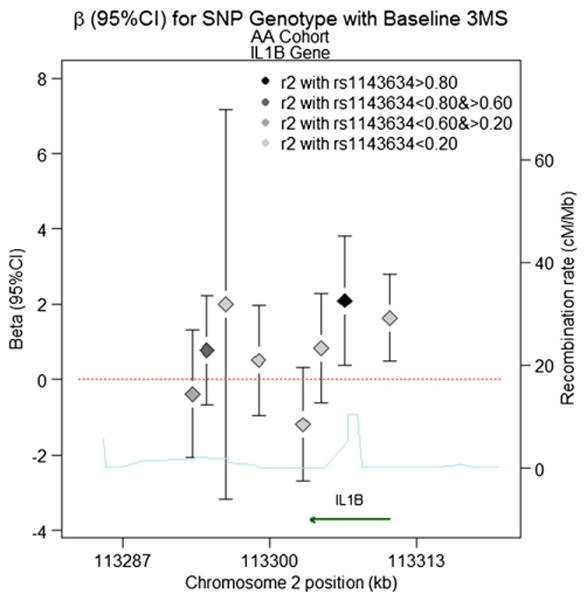
Fig. 5.

Beta (95%CI) for Baseline 3MS Score in the IL1B gene for the AA Cohort Models base on additive inheritance. Chromosome position is shown in kilobases (kb). Genes annotations are shown on the bottom of the figure, where the direction of the arrow shows the 5′ to 3′ direction of transcription. Estimated recombination rates in centi-Morgan per Megabase (cM/Mb) are obtained from HapMap data and are plotted directly above the gene to reflect the local linkage disequilibrium structure. Position, annotations and estimated recombination rates use Build 36 coordinates. The dashed line represents an effect size of zero. The point estimate for SNP rs1143634 is located second from the right, denoted by a black diamond, with error bars corresponding to the 95%confidence interval. For all other SNPs, the color of the diamond denoting the effect size reflects the pairwise correlation between a given marker and SNP rs1143634 (r2), so that darker shades of gray are highly correlated, and lighter shades of gray or not strongly correlated (see legend). Software to create the figure is adapted from the R script provided for the Regional Association Plot on the Broad Institute website (http://www.broadinstitute.org/science/projects/diabetes-genetics-initiative/plotting-genome-wide-association-results).
