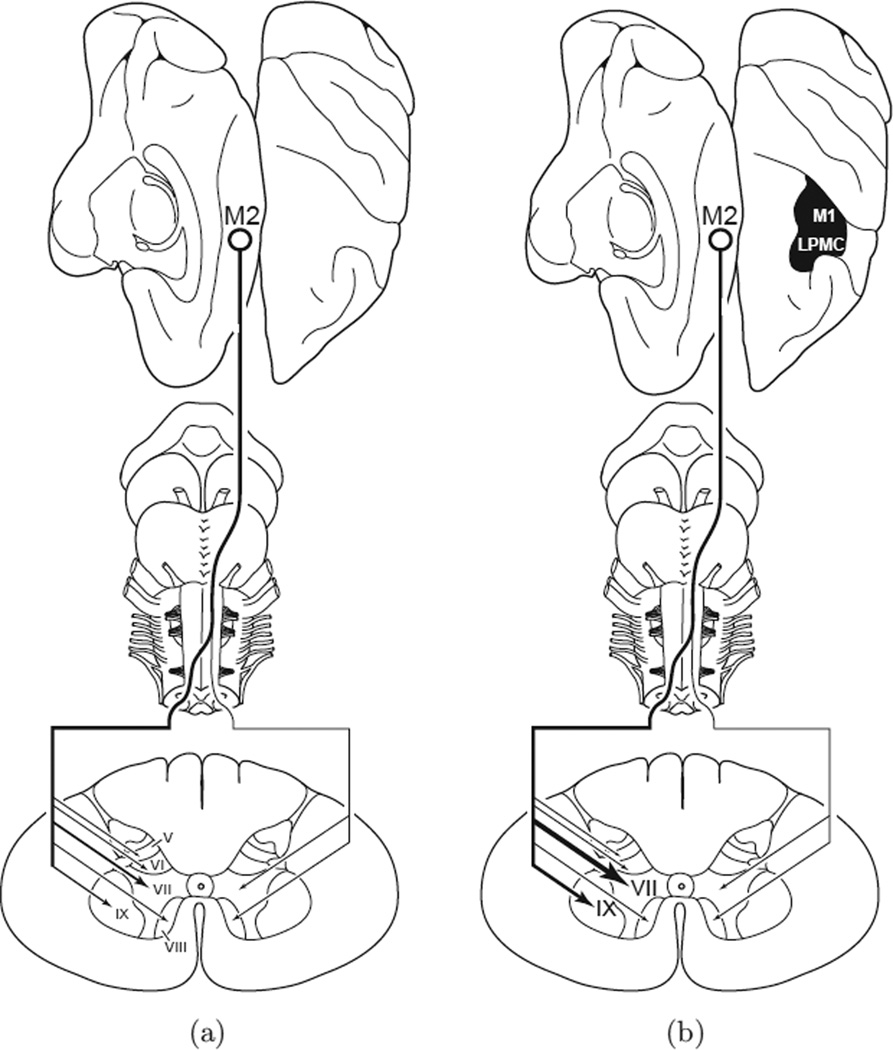
Fig. 7.
Summary diagram illustrating the main findings of McNeal and colleagues [64]. The left diagram (a) illustrates the corticospinal projection from the supplementary motor cortex (M2) in the control experiments. This projection originates from the medial wall of the hemisphere (top, hinged to left from dorsal view of cerebral cortex on right) and most descending fibers cross the midline at inferior brainstem levels (middle) ending in the spinal cord (bottom). The relative intensity of the projection to spinal cord laminae is indicated by line thickness and arrow size. Denser terminal projections are represented by increased line thickness and arrow head size. Progressively lighter terminal projections are indicated by progressively thinner lines and arrowheads. The right diagram (b) illustrates the M2 corticospinal projection in the brain injury experiments after motor recovery of dexterous upper extremity movements. The lesion is located on the dorsal view of the hemisphere (blackened area) and involved the arm representation of the primary motor cortex (M1) and adjacent part of the lateral premotor cortex (LPMC). Extensive enhancement of the contralateral projection to lamina VII and IX occurred following the lateral motor cortical injury but not in other contralateral or ipsilateral laminae. (Fig. 13 — Wiley-Liss, Inc., J Comput Neurol, used with permission.)

