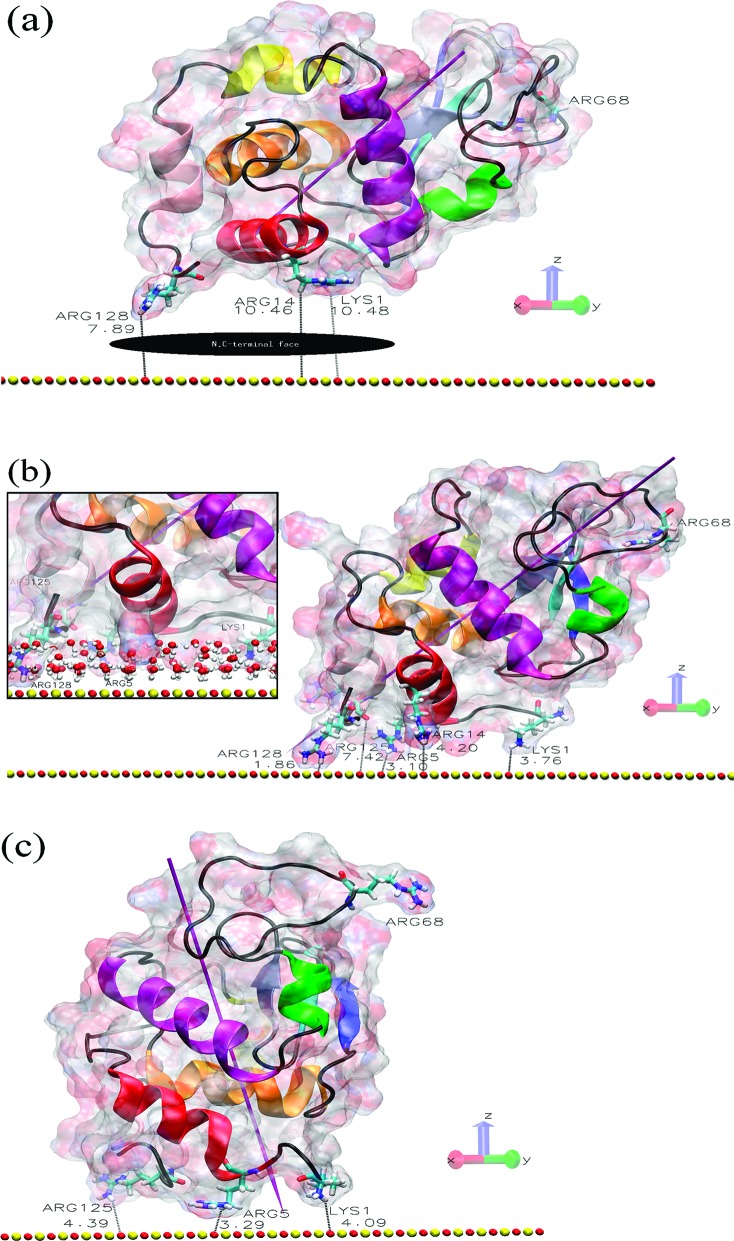
Figure 1.
Protein and surface relative orientation before and after a 90 ns trajectory. (a) Initial view of the HEWL−surface positions in orientation O1 with the N,C-terminal protein face indicated. (b) Final structure of the O1 system, where the inset shows the penetration of the surface water layers. (c) Final structure of the O1_90 ns_R128G simulation, where we start with the O1 structure after the 90 ns adsorption trajectory and then mutate Arg128 to Gly128 and simulate a subsequent 90 ns trajectory (for further details, see the Methods section in the Supporting Information). The shortest protein−surface distances (in Å) are shown, and important residues are labeled. The surface atoms are shown as red (oxygen atoms) and yellow (silicon) spheres. The HEWL surface is shown as a ghost surface colored by charge, with protein secondary structure elements indicated as a cartoon and colored as follows: red, helix A; orange, helix B; purple, helix C; yellow, helix D; pink, helix 310 from domain α; green, helix 310 from domain β; blue, sheet β1; cyan, sheet β2; gray, sheet β3; black, other structures including loops. Important residues are shown as licorice and colored by element (hydrogen, white; carbon, cyan; nitrogen, blue; oxygen, red). The magenta needle indicates the protein dipole moment.

