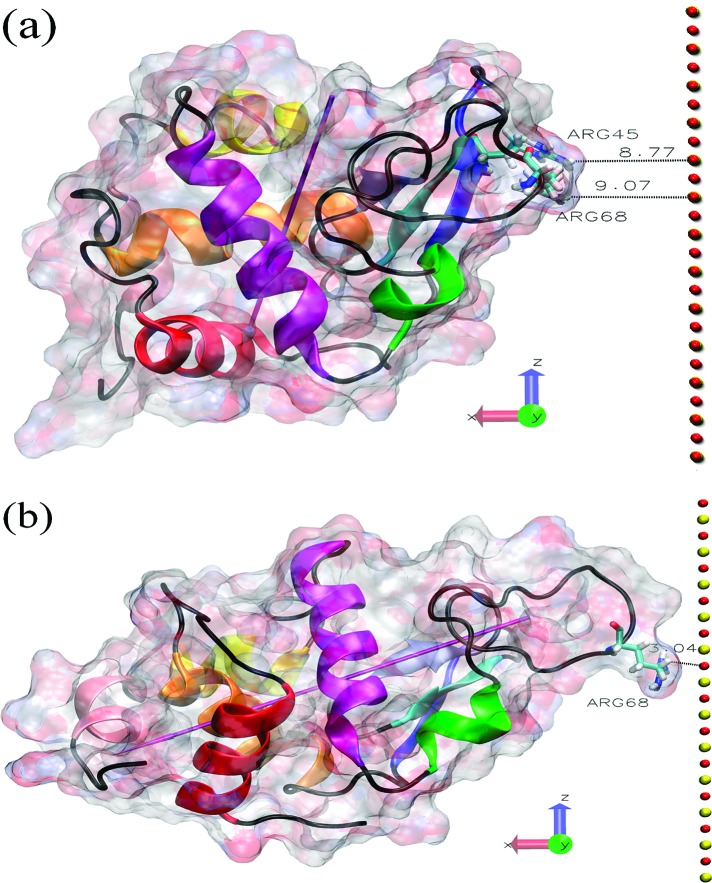
Figure 2.
Protein−surface relative orientation. (a) Initial state of the O4 system. (b) Final structure of the O4 system after the 90 ns trajectory. The coloring scheme is the same as that in Figure 1. In both cases, the shortest initial and final protein−surface distances (in Å) are shown.

