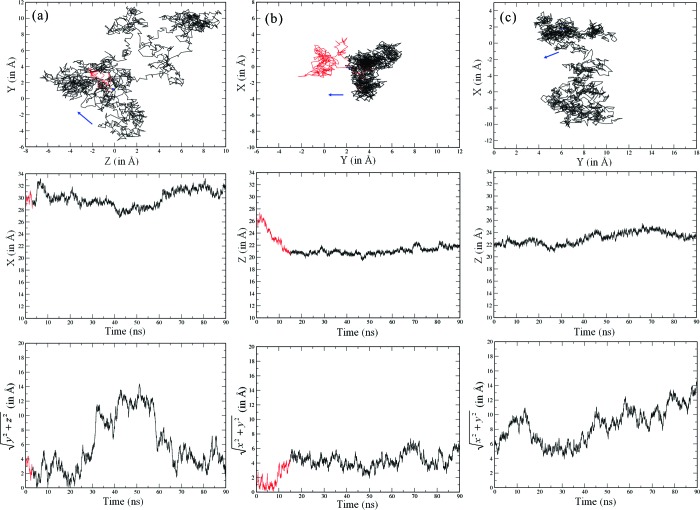
Figure 3.
Protein center of mass (COM) diffusion: (a) O4, (b) O1, and (c) O1_90 ns_R128G. The top plots show plan views of the diffusion across the plane of the surface, with blue dots showing the starting points and the arrows indicating the COM displacement after 0.1 ns. The red part of the plot indicates the diffusion before and during adsorption, and the black part indicates the diffusion on the surface. The middle plots show changes in time of the COM distance perpendicular to the surface. The bottom plots show the distance diffused by the COM across the surface plane over time.

