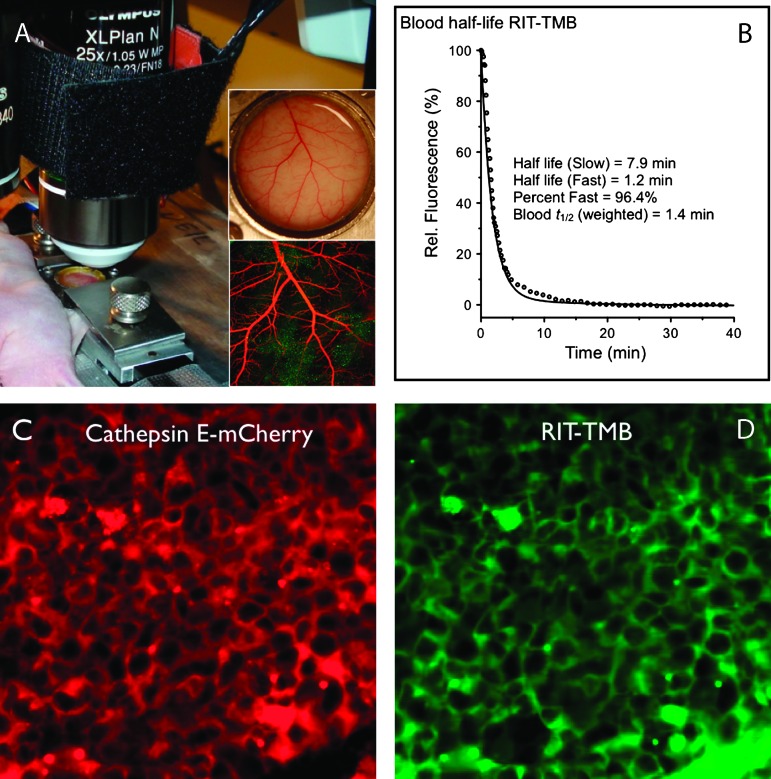
Figure 5.
In vivo PDAC orthotopic intravital microscopy. (A) Setup of intravital window chamber imaging. (B) Blood half-life as measured by serial fluorescence imaging. (C) Representative section showing CTSE-mCherry expressing PDAC cells. (D) Identical section as shown in C, following intravenous administration of RIT-TMB. Some of the agent can still be seen in large vessels (bottom right). Note the good co-localization with CTSE-mCherry.

