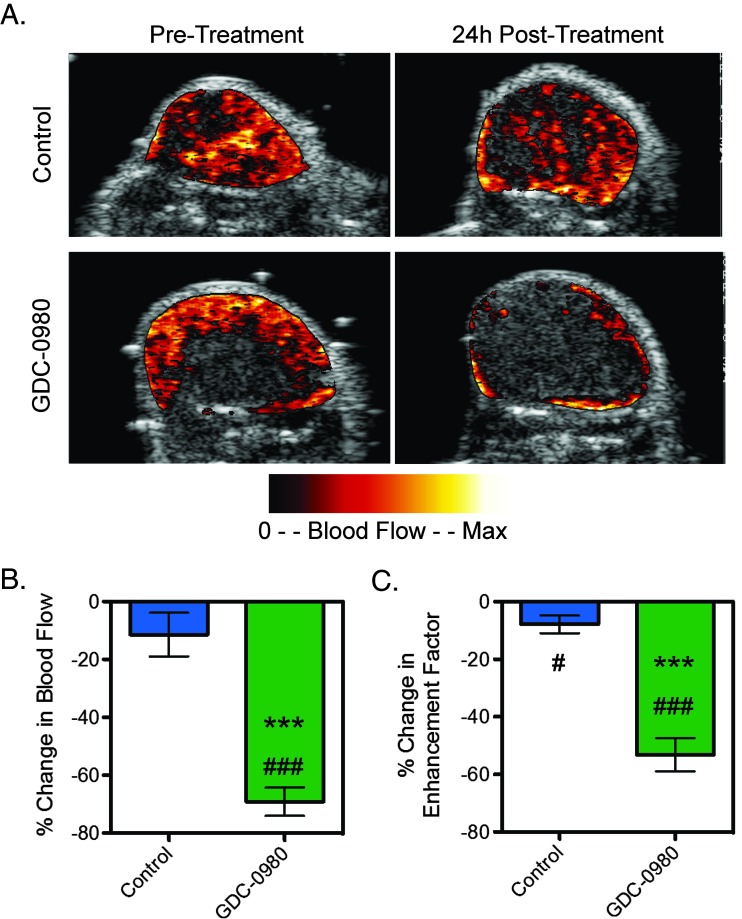
Figure 5.
Inhibition of PI3K and mTORC1/C2 affects vascular function in the HM-7 xenograft model as assessed by DCE-U/S. (A) Representative false-colorized DCE-U/S blood flow maps overlaid onto their anatomic images pre-treatment or 24 hours post-treatment with MCT vehicle (control) or 7.5 mg/kg GDC-0980 (n = 6/group). (B and C) Percent change in DCE-U/S-derived (B) blood flow in the enhancing tumor regions and (C) enhancement factor for tumor-bearing mice described in A (mean ± SEM). ***P < .001 versus control by unpaired t test assuming unequal variances; #P < .05, ###P < .001 versus pre-treatment by paired t test.

