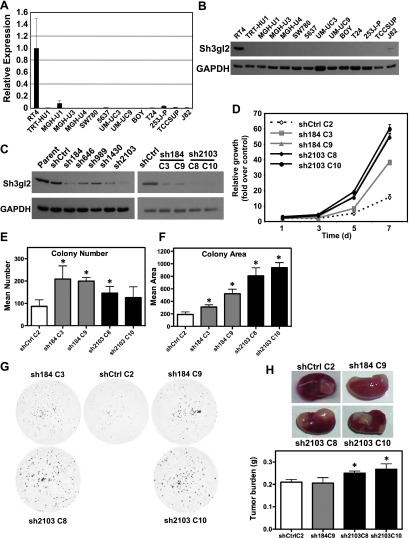
Figure 3.
Sh3gl2 is lost with high frequency in bladder cancer cell lines and regulates cell growth in vitro and in vivo. Sh3gl2 mRNA (A) and protein (B) levels were analyzed in a panel of 20 bladder epithelial cell lines by semiquantitative real-time RT-PCR or immunoblot analysis, respectively; data from 14 cell lines are presented. Only the low-grade papilloma-derived cell line RT4 expressed detectable levels of Sh3gl2. (C) RT4 cells infected with lentivirus encoding shRNAs directed against five distinct regions of the Sh3gl2 transcript (sh184, sh646, sh989, sh1430, and sh2103) or with nontargeting control shRNA (shCtrl) were analyzed for Sh3gl2 expression by immunoblot analysis with two independent anti-Sh3gl2 antibodies and identified sh184 and sh2103 as yielding efficient knockdown of Sh3gl2 (left panel). Single-cell clones isolated from shCtrl (C2), sh184 (C3 and C9), and sh2103 (C8 and C10) were selected as candidate clones for functional analysis (right panel). (D) Proliferation of Sh3gl2-silenced cells, as determined in a biomass assay, was increased in all four clones compared to RT4 control cells at all time points tested (P < .05). Data are representative of at least three independent experiments. Control and Sh3gl2-targeted clones seeded at clonal density were evaluated for (E) colony number and (F) colony area 14 days after seeding. Loss of Sh3gl2 significantly increased cell survival (number) in three of four clones (*P < .01) and proliferation (area) in all four Sh3gl2-silenced clones compared to controls (*P < .01). (G) Representative images of clonal growth assays for four Sh3gl2-silenced clones and the control clone. (H) Tissue recombinants comprising RT4 cells stably silenced with control or Sh3gl2-targeted shRNA combined with rat fetal bladder mesenchyme were implanted under the renal capsule of severe combined immunodeficient mice and harvested 3 weeks after implantation. Representative images indicating grafts in situ are indicated. The graph indicates wet weight of grafts generated from three to four grafts per indicated clone and data are presented as means ± SD.

