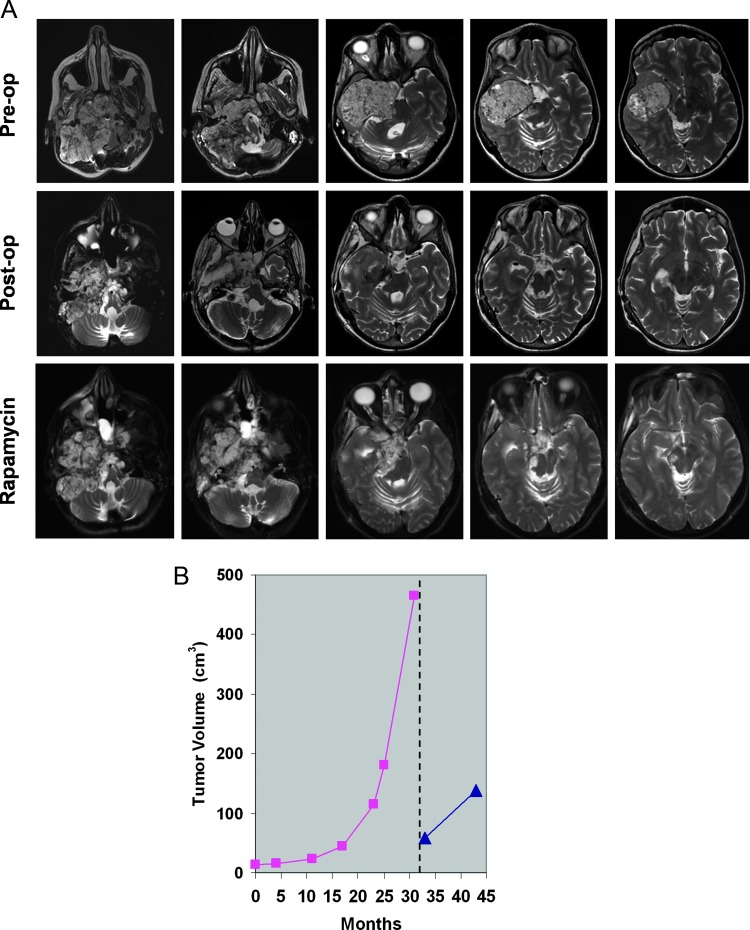
Figure 5.
(A) Axial T2-weighted MR images of patient's chordoma before surgery (upper panel), 1 month after surgery before rapamycin administration (middle panel), and after 5 months of rapamycin therapy (lower panel). (B) Growth curve of patient's chordoma over 31 months before surgery (purple line) and 10 months after surgery including 9 months of rapamycin therapy (blue line).

