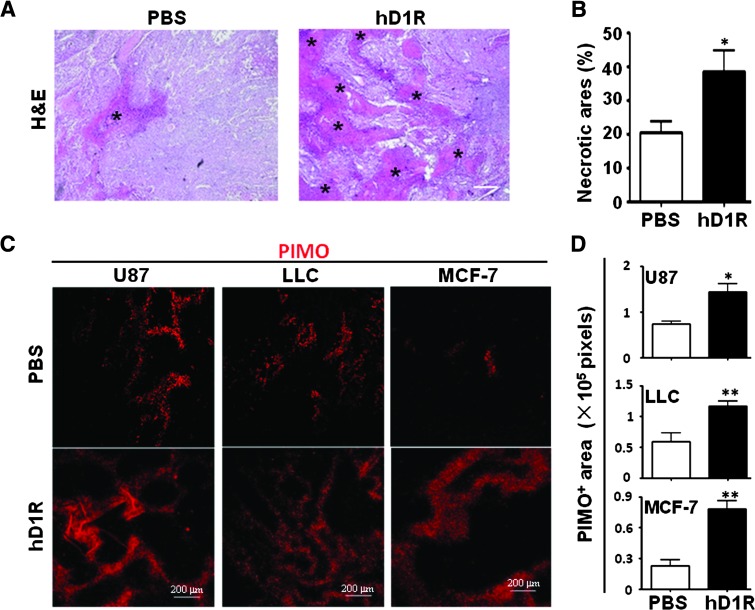
Figure 4.
hD1R enhanced tumor hypoxia. (A, B) Tumors were dissected on the ending day of the experiments and subjected to H&E staining (A). Necrosis areas were compared (B). Data from U87 inoculated nude mice were shown. The necrotic areas are marked by asterisks. (C, D) On the last day of the experiments, mice in A were injected i.p. with PIMO and were sacrificed 1 hour later. Tumors of the PBS and hD1R groups were dissected, sectioned, and stained with anti-PIMO(C). PIMO+ (hypoxic) areas per field were quantified and compared (D). Bars, means ± SD. *P < .05, **P < .01, n = 8.

