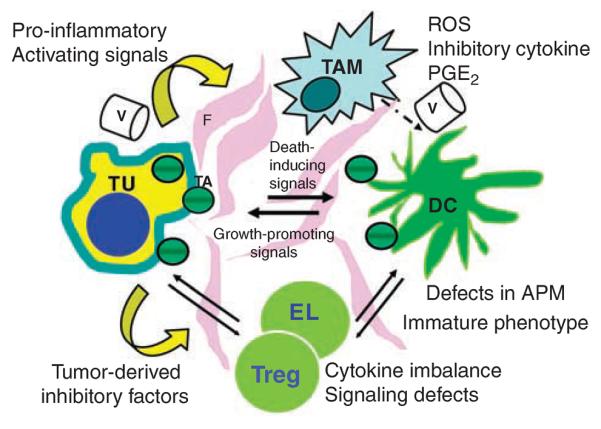
Figure 1.

A diagram depicting the tumor microenvironment. Interactions of various cells with each other, fibroblasts (F) in the tumor stroma and blood vessels (V) are indicated by arrows. Although the tumor (TU) generates signals inducing dysfunction and death of immune cells, the latter are a source of signals promoting tumor growth. TAM, tumor-associated macrophages; DC, dendritic cells; EL, effector lymphocytes; Treg, regulatory T cells; TA, tumor-derived antigens; ROS, reactive oxygen species; PGE2, prostaglandin E2.
