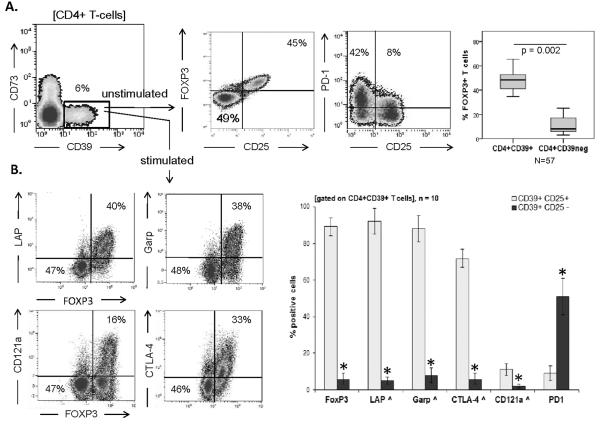
Figure 1. Phenotypic features of CD4+CD39+ cells.
(A) PBMCs from HCs were isolated, gated as shown. FOXP3 and PD-1 expression by the CD25+FOXP3+ subset and % of FOXP3+ expression by CD4+CD39+ and CD4+CD39neg T cells were examined by flow cytometry. Box plots show quartiles for 25, 50, 75 as boxes, and values for 0% and 100% as whiskers. (B) CD4+CD39+ T cells were stimulated with SEB for 6 h. Co-expression of TGF-β-associated LAP, GARP, IL-1-receptor CD121a, CTLA4 with FOXP3 was determined. Data are representative (contour plots) or means + SD (bar graphs) of 10 independent experiments each performed using cells from a different HC *p < 0.05 for A&B. All p values in this and other figures were determined using Kruskal-Wallis and two-tailed exact Wilcoxon-Mann Whitney tests.

