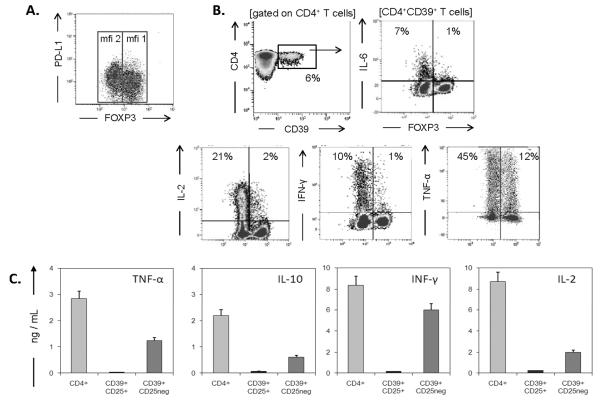
Figure 2. Expression of PD-L1 and the cytokine profile in CD4+CD39+ T cells.
(A) PD-L1 and FOXP3 co-expression on unstimulated CD4+CD39+ T cells isolated from PBMCs of HCs. (B) PBMCs obtained from HCs were stimulated with SEB for 6 h in the presence of Brefeldin A and stained for intracellular IL-6, IL-2, IFN-γ and TNF-α expression in CD4+CD39+ T cells. Density plots are representative for more than 30 individual experiments each performed with cells of a different HC; (C) Subsets of CD4+CD39+ and CD4+CD39neg cells were single-cell sorted, stimulated with OKT3/anti-CD28 Ab-coated beads and cultured. Supernatants were collected after 48 h, and cytokine concentrations were measured by Luminex. The data are means ± SD for three cultures. CD4+CD39neg Tconv cells served as a positive reference for cytokine measurements.

