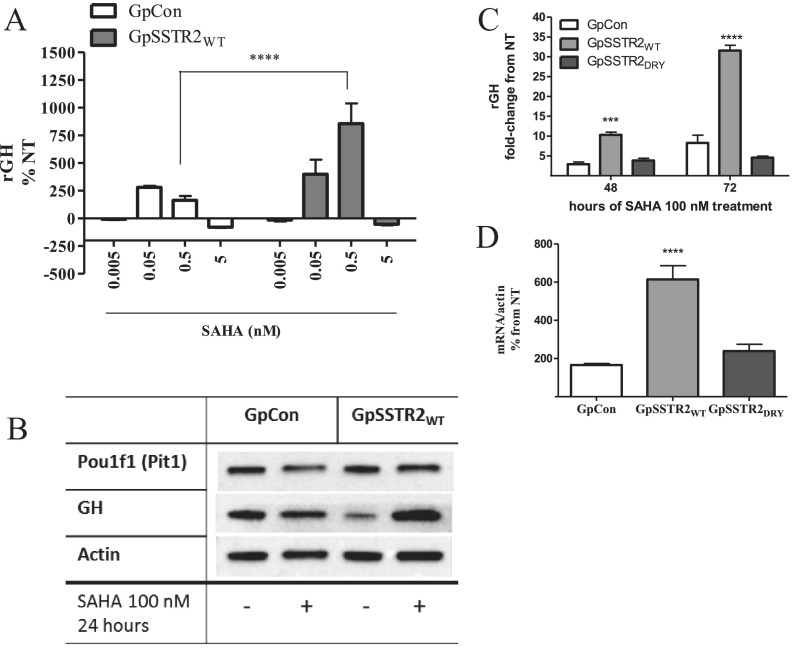
Figure 6.
SAHA effects on GH synthesis and secretion in GpCon and GpSSTR2WT cells. A, SAHA (5–500 nM, for 48 hours) effects on GH levels in GpCon and GpSSTR2WT cell medium corrected to WST-1 measurement. B, Western blot analysis for GH and Pou1f1 (Pit-1) compared with actin in GpCon and GpSSTR2WT cells, treated with SAHA (100 nM) for 48 hours and compared with vehicle-treated cells (not treated [NT]). C, GpCon, GpSSTR2WT, and GpSSTR2DRY cells were treated with either SAHA (100 nM) or vehicle for 48 and 72 hours, medium GH levels were measured by RIA, and results are presented as fold change from GH levels in matched vehicle-treated cells (NT). D, Rat GH mRNA levels in GpCon, GpSSTR2WT, and GpSSTR2DRY cells, 48 hours after SAHA (100 nM) or vehicle treatment. Cells were lysed, RNA was extracted, and GH mRNA levels were measured by TaqMan gene expression assays. Results are presented as percentage of change from vehicle-treated cells (NT). ****, P < .0001 compared with GpCon cells.

