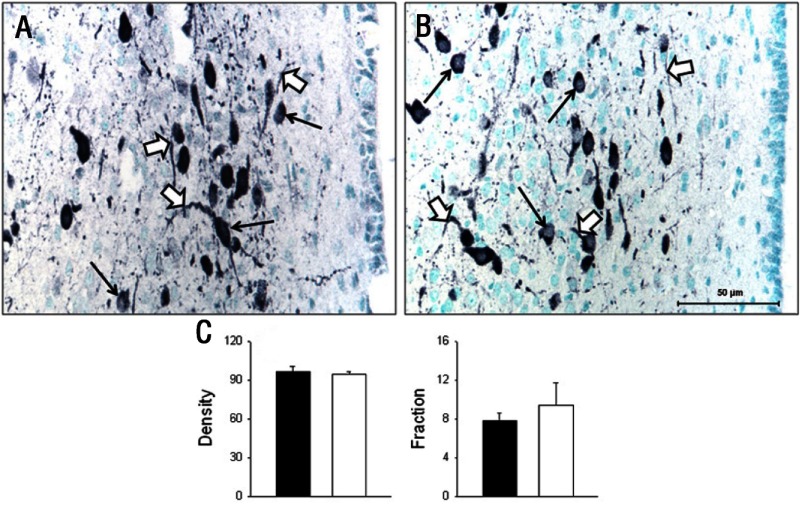
Figure 3.
Photomicrographs (A and B) and summary (C) of AVP peptide expression (black product) in neuronal perikarya (thin arrows) and neuronal fibers (black arrows) in the hypothalamic PVN of baboon fetuses from mothers fed as ad libitum controls (A, CTR; C, CTR, filled bars; n = 7) or IUGR (B, mothers fed 70% CTR diet; C, IUGR, open bars; n = 6) from 0.16 to 0.9 gestation with cesarean section/tissue collection at 0.9 gestation (165 dG). Data are expressed as means ± SEM. No difference (P ≫ .05) was seen between groups in AVP expression. Scale bar applies to both micrographs.

