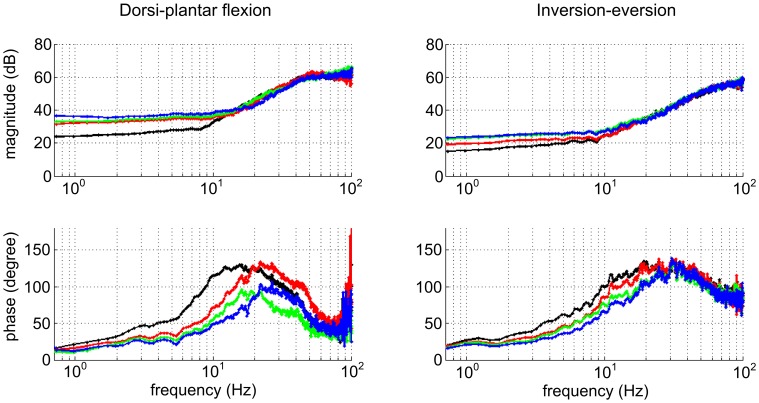
Figure 3.
Variation of dynamic ankle mechanical impedance with muscle activation (Lee et al., 2012b). Bode plots show impedance up to 50 Hz in principal axis directions. Left column: Dorsi-plantar flexion. Right column: Inversion-eversion. Top row: magnitude. Bottom row: phase. Color code: black, fully relaxed; red, tibialis anterior active at 10% maximum voluntary contraction (MVC); green, soleus active at 10% MVC; blue, tibialis anterior and soleus co-contracted, each at 10% MVC. The effect of muscle activation is to increase impedance below about 10 Hz, predominantly in dorsi-plantar flexion. The phase plots suggest dynamic behavior more complex than second-order.

