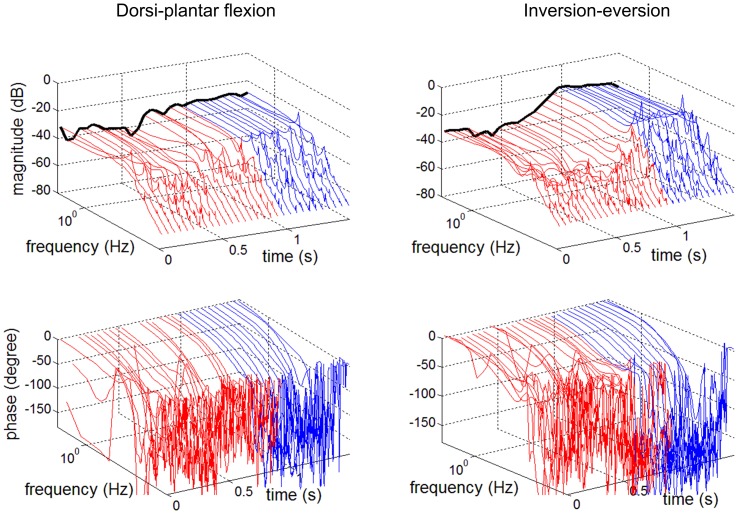
Figure 4.
Time-variation of ankle dynamics during level walking (Lee et al., 2012a). Bode plots of admittance (inverse of impedance) at 50 ms intervals. Left column: Dorsi-plantar flexion. Right column: Inversion-eversion. Top row: magnitude. Bottom row: phase. Time zero is at heel strike. Color code: red, stance phase; blue, swing phase. The black line depicts the static (zero frequency) component. Note the substantial magnitude changes throughout the gait cycle.

