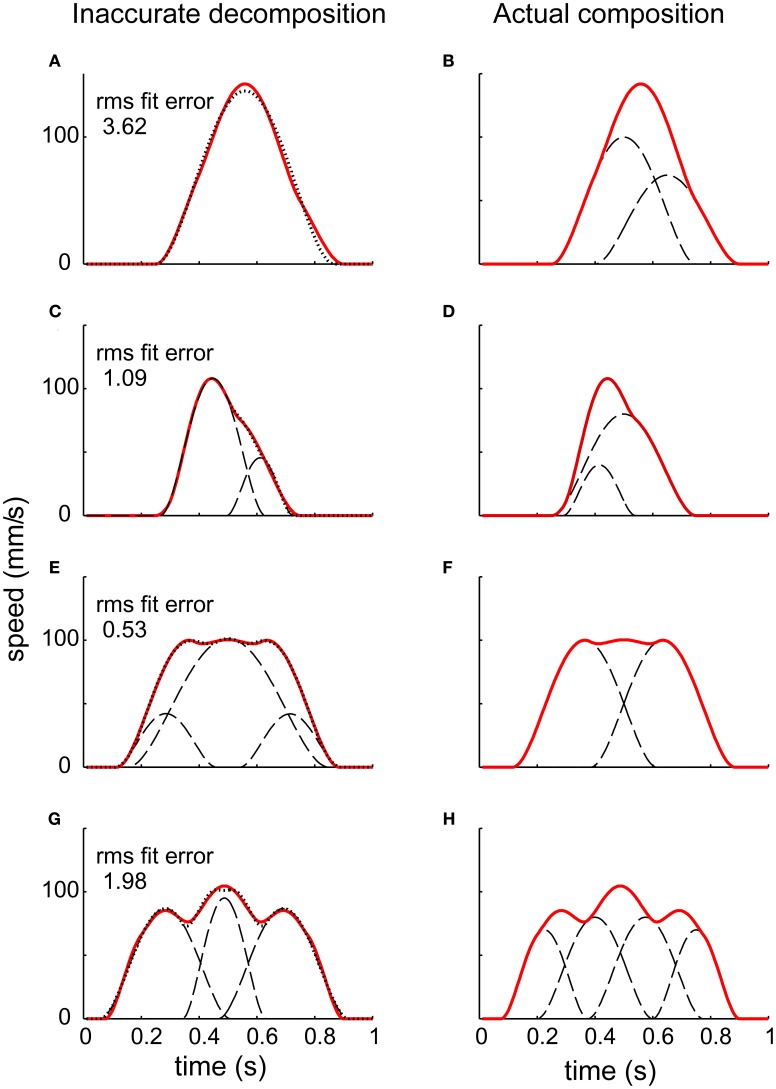
Figure 5.
The challenge of decomposing a continuous trajectory into submovements (Rohrer and Hogan, 2003). The right column shows simulated speed profiles resulting from different combinations of underlying submovements. Note that the number of peaks does not correspond to the number of submovements. The left column shows the result of decomposition using “greedy” algorithms. Though the RMS fitting error is low, the submovements identified do not resemble those used to construct the speed profiles.

