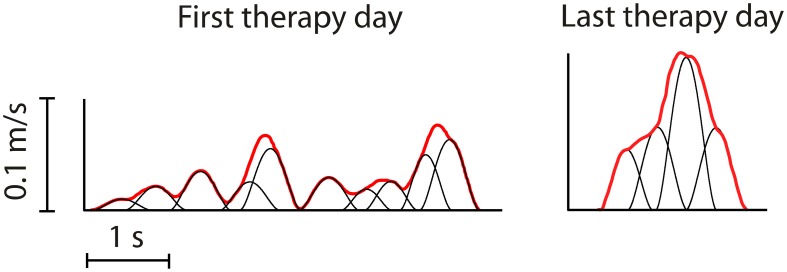
Figure 7.
Typical movement profiles between the same target positions from one patient recorded on the first and last days of therapy (Rohrer et al., 2004). Bold lines indicate measured tangential speed. Fine lines indicate submovements identified using a global optimization algorithm. The later profile shows fewer submovements, which have greater peak speed, duration and overlap.

