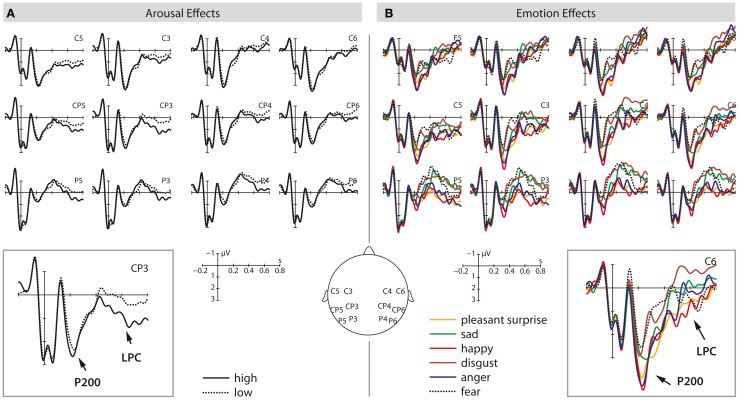
Figure 3.
This illustration shows the P200 and LPC effects at selected electrodes for high/low arousing stimuli (A) and the six different emotional categories tested (B). The left panel shows average waveforms for high (solid) and low (dotted) arousing stimuli from 200 ms before stimulus onset up to 800 ms after stimulus onset. On the right side, average waveforms for different emotional prosodies are displayed from 200 ms before sentence onset up to 800 ms after stimulus onset.

