
Figure 2.
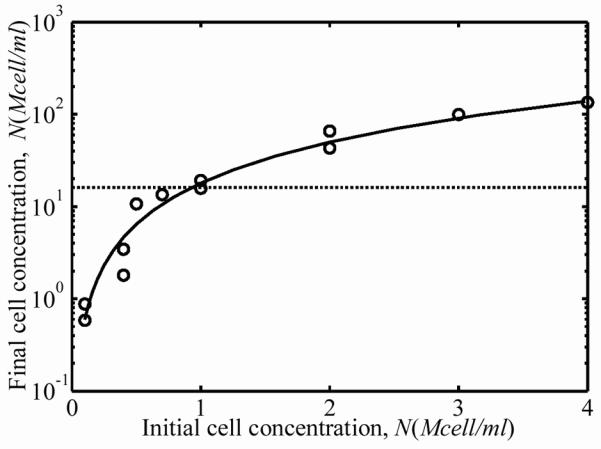
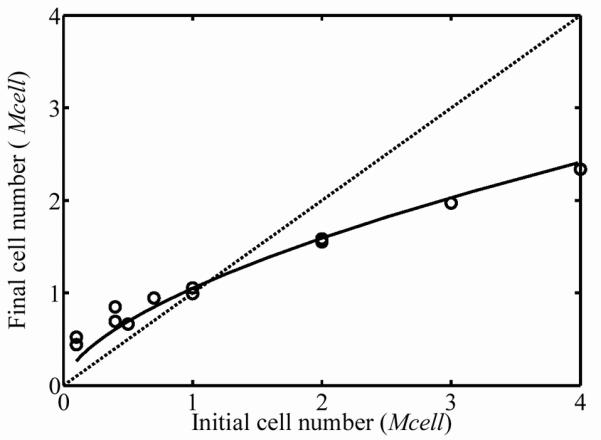
(a) Cellular concentration after three days of incubation increased monotonically with starting cell concentration. The dashed line is the concentration at which cells are predicted to form a contiguous, steric network. (b) The dashed line in Fig. 2b represents no change in the cell number after incubation; values above this line indicate an increase in the number of cells, while values below this indicate a decreasing number of cells, as was the case for FPMs beginning with very high cell concentrations.