
Figure 3.
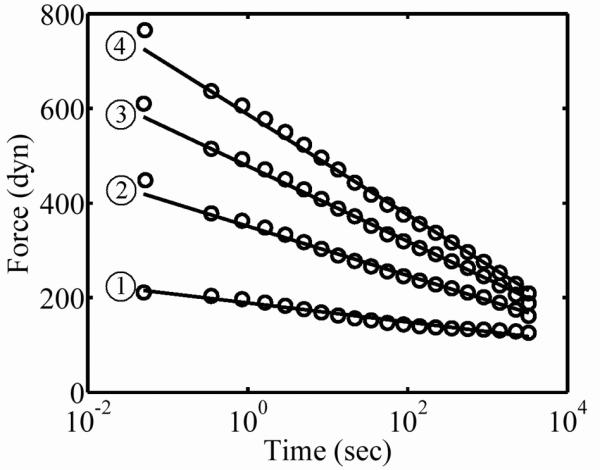
Typical logarithmic relaxation response of a FPM subjected to a rapid stretch. The sample shown had a final cell concentration of 10.7 Mcell/ml and was tested in DMEM at strain levels ε=0.02, 0.08, 0.15, and 0.22, from (1) through (4), respectively. The standard deviation of the data shown did not exceed the size of the circles, and was 4, 8, 12 and 16 dynes, for (1) through (4), respectively.