
Figure 6.
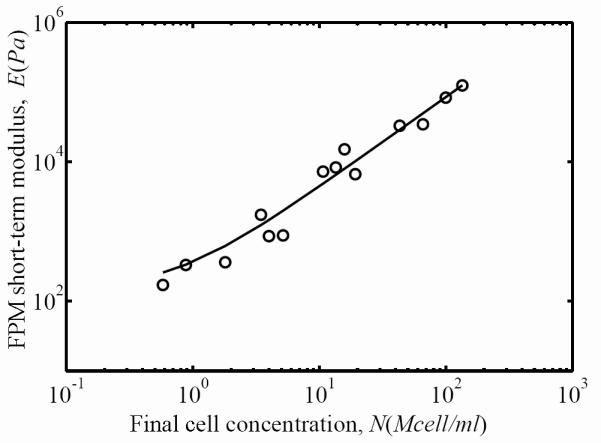
The overall FPM stiffness after three days of incubation increased monotonically with final cell concentration. Circles represent the experimental measurements of the FPM short-term secant modulus as a function of the final cell concentration, and the solid line is a power-law fit (Eq. 6).