
Figure 9.
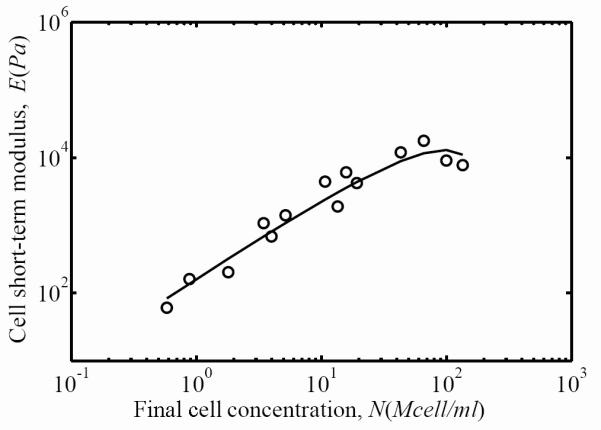
The contribution of the cell to overall FPM stiffness after three days of incubation increased with final cell concentration for all but the highest of cell concentrations. Circles represent the experimental measurements of the FPM short-term secant modulus as a function of the final cell concentration, and the solid line is the difference between the fits for FPM and ECM (Eq. 6).