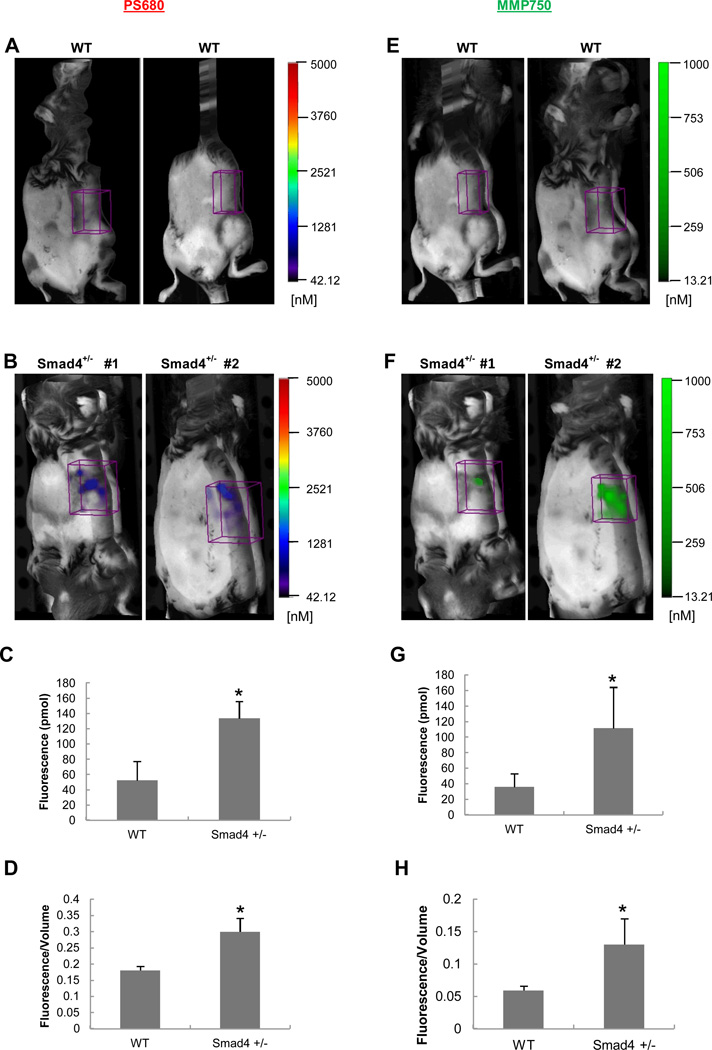
Figure 2.
In vivo imaging of WT and Smad4 +/− mice injected with cathepsin and MMP probes. ROIs were placed in the stomach region from each animal. (A, E) Representative images from WT controls; (B, F) Representative images from Smad4+/− mice; (C, G) 3D quantification of total fluorescence (pmol) and (D, H) fluorescence intensity (total fluorescence divided by volume). Histograms show mean ± SEM; n=4 for Smad4 +/− mice and n=3 for the WT mice; *p=<0.05 compared with WT.

