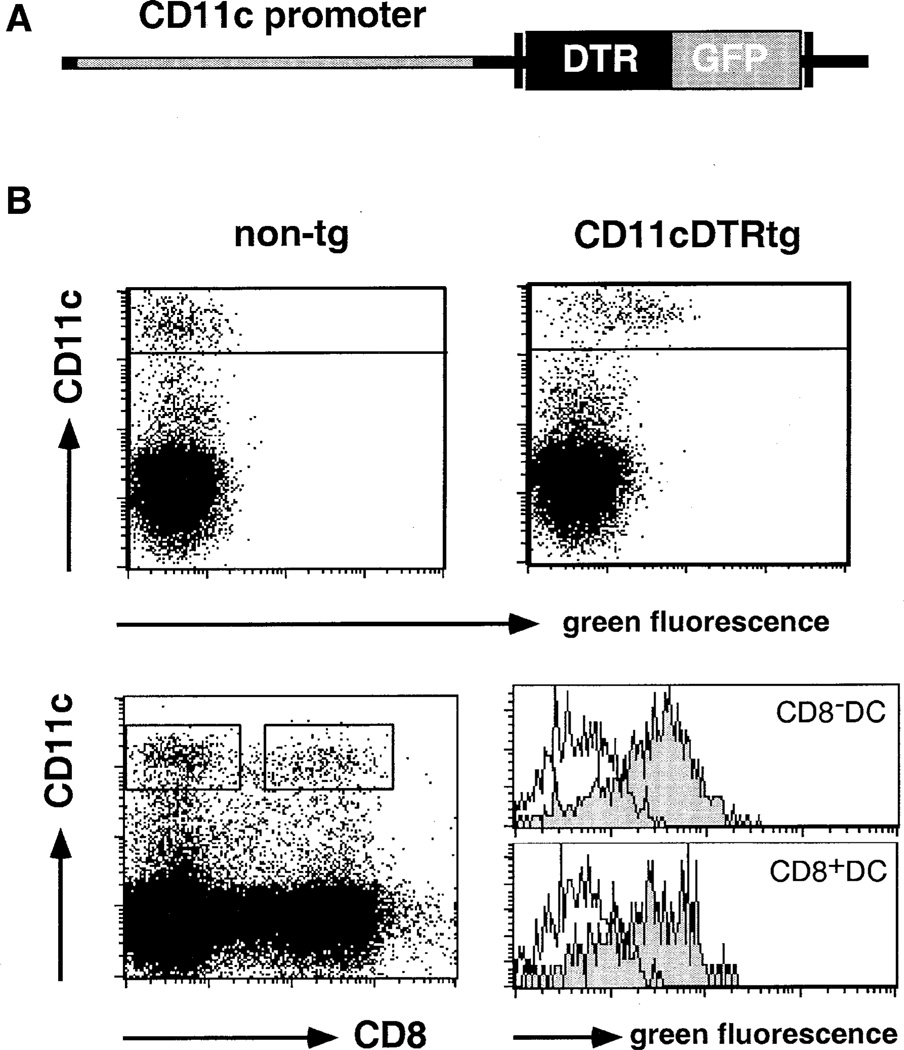
Figure 1. Phenotypic Characterization of DTR Transgenic Mice.
(A) Schematic representation of the DTR/GFP transgene.
(B) Flow cytometric analysis of spleen cells of DTR transgenic (line 57) and nontransgenic FVB/N mice indicating GFP expression in CD11c+ DC. Histograms show GFP expression in CD8+ and CD8− DC subsets. Histogram gates are indicated in the dot plot. Open histograms, wild-type cells; filled histograms, DTR transgenic cells. Dead cells were excluded by propidium iodide (PI) staining.

