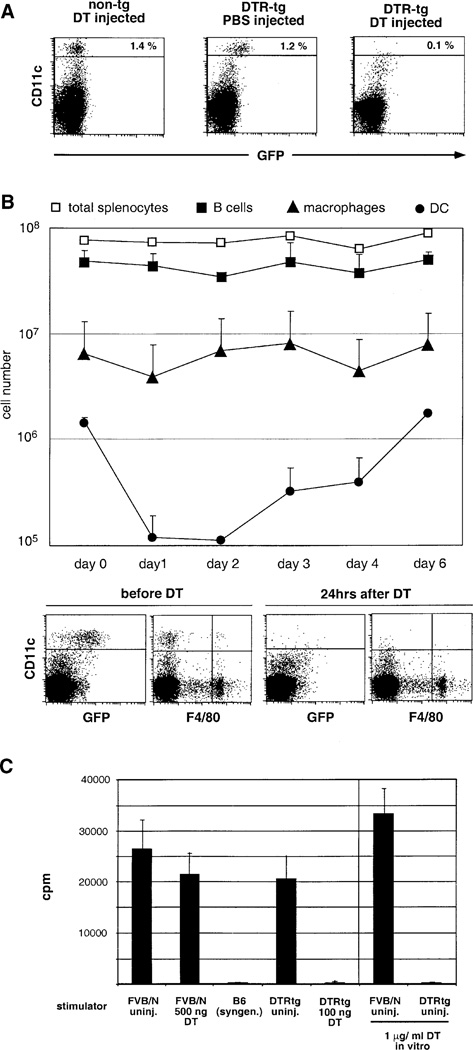
Figure 2. DT Sensitivity of the DC Compartment in DTR Transgenic Mice.
(A) Flow cytometric analysis of spleen cells of wt and DTR-transgenic (line 57) FVB/N mice 24 hr after injection of 100 ng DT or control vehicle.
(B) Analysis of splenic APC populations of homozygous CD11c-DTR transgenic mice (line 57) after i.p. injection of 100 ng DT(day 0). Data represent mean of two mice per time point and are representative of two independent experiments. B cells are represented by squares and defined as being CD19+; macrophages are represented by triangles and defined as being F4/80+; DC are presented by circles and defined as being CD11c+. Open squares represent total splenocyte counts. Dot blots below the graph show a representative flow cytometric analysis of two time points.
(C) Mixed leukocyte reaction with 8 × 10⁵ stimulator splenocytes (FVB/N; H2q) and 105 responder T cells (C57BL/6; H2b). Data are representative of three experiments with similar results. Note that the MLR was also abrogated by addition of DT during the culture resulting in in vitro DC depletion.

