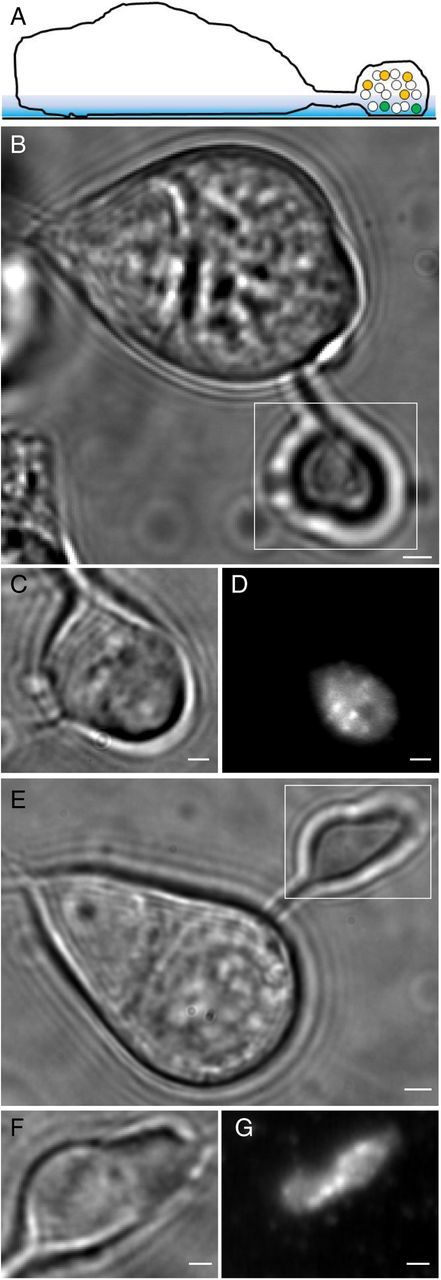
Figure 1.

Bright-field and fluorescent images of rods loaded with FM1–43 or dextran-conjugated pHrodo. A, Diagram illustrating a dye-loaded rod lying on a glass coverslip. Only a small number of vesicles in the synaptic terminal are loaded with dye (yellow and green circles), and only those vesicles (green circles) within the evanescent field of illumination (colored blue in the diagram) at the interface between the cell membrane and cover glass are visible by TIRFM. B, Bright-field image of an isolated rod photoreceptor. Rods typically lost their light-sensitive outer segments during the isolation procedure, and so only the cell body, axon, and terminal remain. C, Higher-magnification view of the synaptic terminal (enclosed by the box in B). D, TIRFM image (average of 100 images acquired at 30 ms/frame) of the same synaptic terminal. The region of terminal membrane in contact with the glass coverslip made a faint fluorescent footprint. The bright spots in the image reflect visits to the membrane by FM1–43-loaded organelles during the 3 s acquisition period. One can also see other inhomogeneities in FM1–43 fluorescence, such as the dark area near the center of the terminal that may be attributable to regional differences in membrane adhesion to the glass or membrane composition. E–G shows similar bright-field and TIRFM images of a rod loaded with dextran-conjugated pHrodo. Scale bars: B, E, 2 μm; C, D, F, G, 1 μm.
