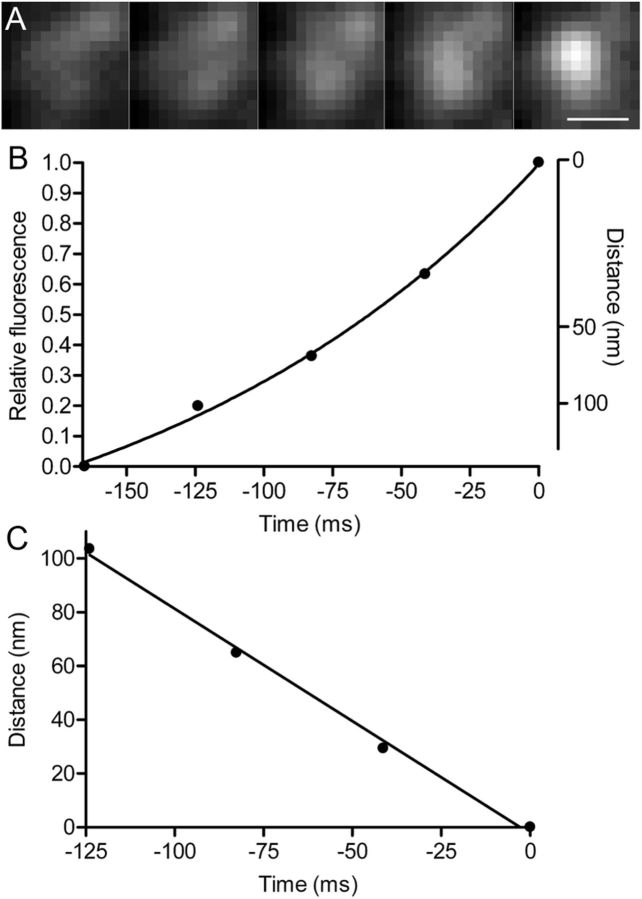
Figure 11.
Velocity of approach for newly arriving vesicles. A, A series of images illustrating the increase in fluorescence intensity as a pHrodo-loaded vesicle approached the membrane before fusion. B, Relative fluorescence intensity [I(z)/I(0)] plotted against time. The right ordinate shows the vertical distance from the membrane at each time point calculated using Equation 3. The line shows a fit to the data with a Boltzmann function. C, Approach velocity was determined from the linear slope of the relationship between vesicle distance from the membrane and time. In this example, the slope was −838 nm/s. Scale bar, 0.5 μm.

