Figure 2.
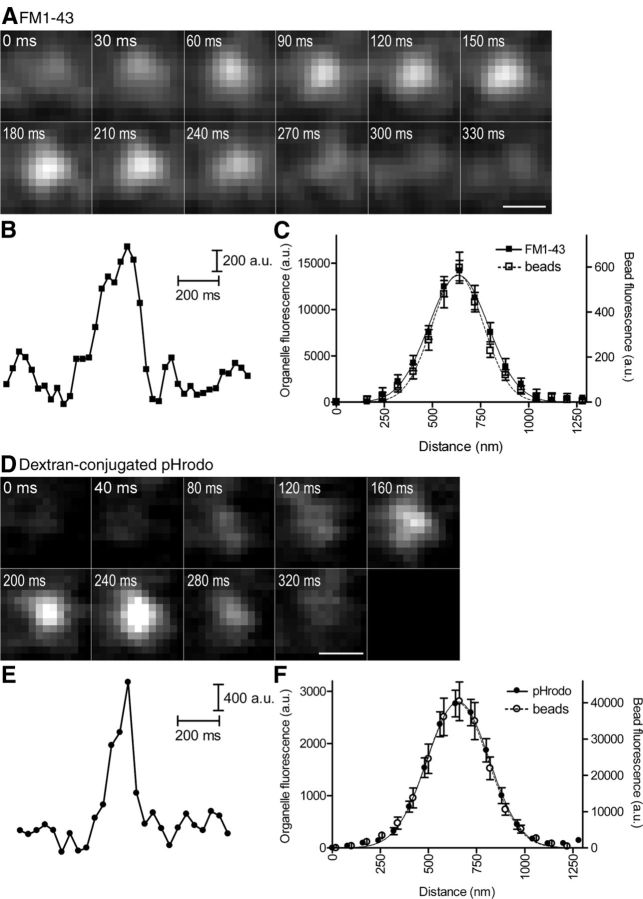
FM1–43- or pHrodo-labeled organelles had a diffraction-limited appearance that matched small fluorescent microspheres similar in size to synaptic vesicles. A, D, Consecutive images showing the disappearance of fluorescent organelles from rod terminals loaded with FM1–43 (A) or dextran-conjugated pHrodo (D) during 50 mm KCl puff. B, E, Changes in fluorescence plotted as a function of time for regions of interest enclosing FM1–43-stained (B) or pHrodo-stained (E) organelles. C, F, Fluorescence intensities measured along lines placed through the centers of FM1–43-stained (C, solid line) or pHrodo-stained (F, solid line) organelles, aligned at their peaks, and fit with Gaussian functions. Overlaid are fluorescence intensity profiles for 25 nm FM1–43-stained amine latex microspheres (C, dashed line; Invitrogen) or 40 nm red microspheres (F, dashed line; FluoSpheres; Invitrogen). Scale bar, 0.5 μm.

