Figure 8.
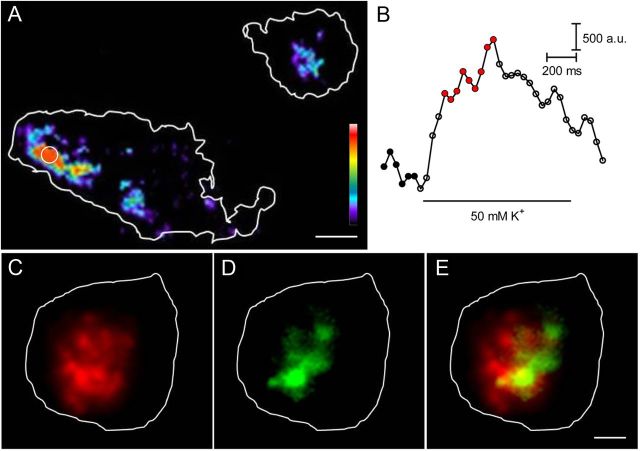
Release sites cluster close to the ribbon. To observe release of a large number of vesicles, rods were incubated with pHrodo for 30 min. Release was then stimulated by puff application of 50 mm KCl for 1 s. A, Vesicle recruitment map generated by subtracting the average of six images before the puff (filled black circles in B) from the average of nine images (red circles in B) during the puff. The two terminal footprints of a rod attached to the coverslip are outlined in white. B, Time course of fluorescence changes measured in a region of interest placed over the area with the largest fluorescence change (white circle). C, Vesicle recruitment map of a rod terminal loaded with pHrodo by 30 min incubation. The rod was voltage clamped and stimulated by sustained depolarization to −15 mV. The vesicle recruitment map was generated by subtracting the average of seven images before stimulation from the average of 19 images obtained during stimulation. D, Ribbons were labeled by introducing a HyLite488-conjugated, high-affinity Ribeye-binding peptide (250 nm) through the patch pipette and visualized by using a 488 nm laser angled to produce epifluorescent illumination. E, Overlay of images in C and D. Scale bar, 1 μm.

