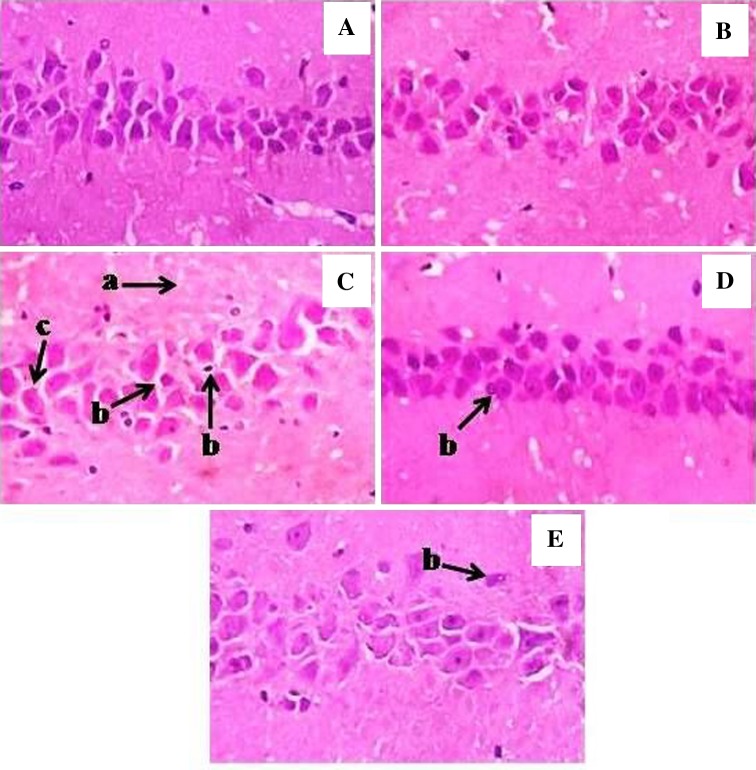
Fig. 2.
Histopathological changes in hippocampus region of experimental rat brain sections. A Normal control; B COE alone; C MSG alone; D MSG + COE 100 mg/kg; E MSG + COE 200 mg/kg. Arrows indicates mildly separated interconnected neuropil fibers (a), shrunken and darkly stained cells (b), decreased CA1 layer & dispersed astroglial cells (c)

