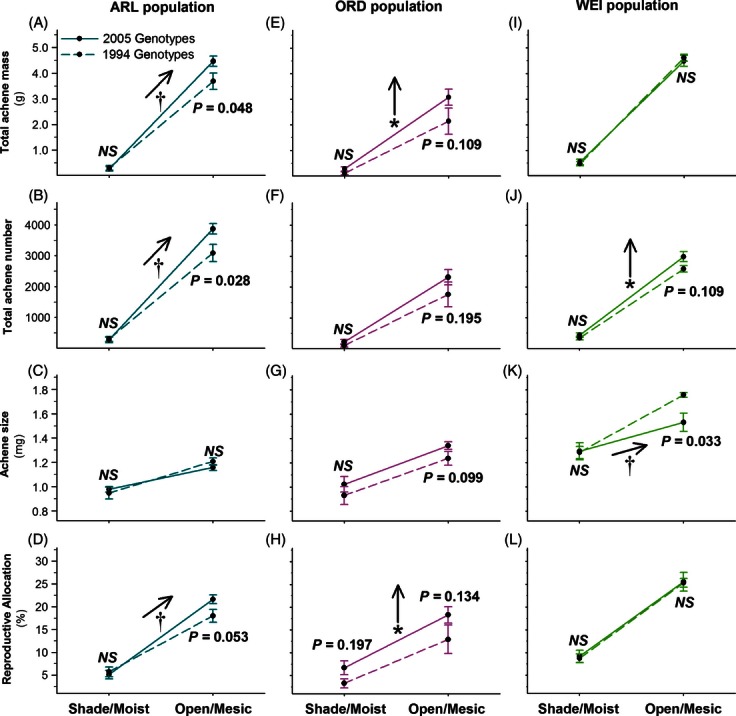
Figure 2.

Population differences in fitness component evolution. Population means are shown ± 1 SE for 8–10 genotypes per collection year. Vertical arrows indicate significant main effect of Year in single-population anova; arrows parallel to 2005 norm of reaction indicate significant Treatment × Year effect. P-values are given from One-way anova testing for the effect of year within each population and habitat treatment. *P < 0.05; †P ≤ 0.10.
