
Figure 2.
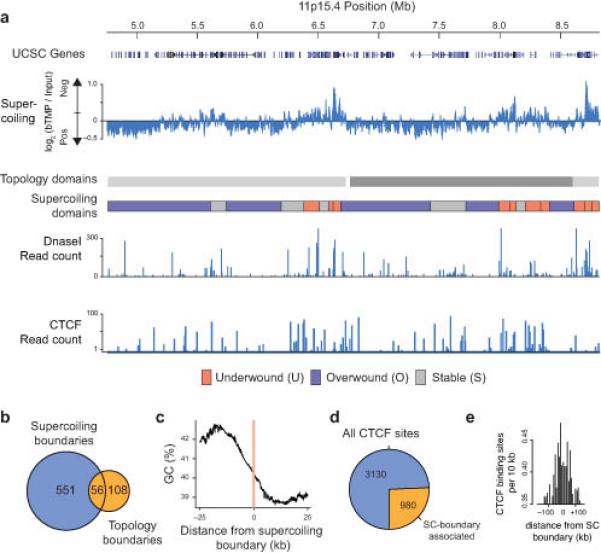
Organization and boundaries of supercoiling domains. (a) Microarray data showing bTMP binding, indicative of DNA supercoiling, at HSA 11p15.4 spanning two topological domains31. Distribution of DNaseI sensitive sites and CTCF binding sites in RPE1 cells obtained from the ENCODE project. (b) Venn diagram showing the overlap between topological domain boundaries31 and supercoiling (SC) boundaries across HSA 11. The overlap was determined by taking a +/− 20 kb window at each topological boundary and assessing whether this overlapped with a SC boundary (P < 0.01 by random permutation). (c) Graph showing the base composition around SC boundaries. (d) Pie chart showing the number of CTCF sites on HSA11 located near to a SC-boundary. The overlap was determined by counting the number of CTCF binding sites within a +/− 20 kb window at each SC-boundary. (e) Bar chart showing the number of CTCF binding sites surrounding a SC-boundary (KS test compared to randomly generated data, P < 2.2 × 10⁻¹⁶).