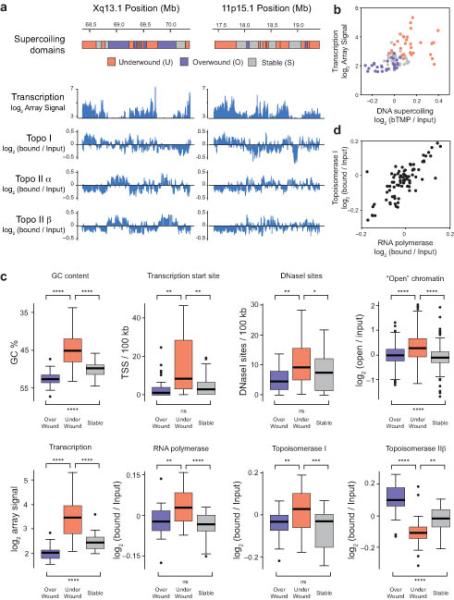
Figure 4.

RNA polymerase and topoisomerases define supercoiling domains. Diagrams showing the arrangement of supercoiling domains at HSA Xq13.1 (a) and HSA 11p15.1 (b) and microarray data showing the distribution of RNA transcripts and ChIP for topoisomerase (topo) I, topoisomerase IIα and IIβ binding across the genomic loci. Transcription is presented as log2 (array signal) whilst ChIP data is shown as log2 (bound/input). B. Scatter plot showing the relationship between transcription and DNA supercoiling in under-wound, over-wound and stable domains. (c) Boxplots showing GC content, transcription start site density, DNaseI site frequency, “open chromatin”, RNA transcription, RNA polymerase II binding, topoisomerase I and topoisomerase IIβ binding at “over-wound”, “under-wound” or “stable” supercoiling domains. Boxplots are as described in Fig. 3 and outliers are shown as black dots. Significance was assessed by t-test and asterisks correspond to the P-value (no *, P > 0.05; *, P < 0.05; **, P < 0.01; ***, P < 0.001; ****, P < 0.0001). (d) Scatterplot showing the relationship between topoisomerase I and RNA polymerase II binding within different supercoiling domains.
