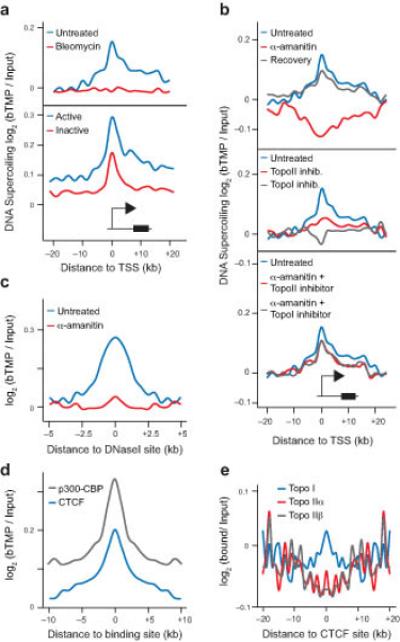
Figure 5.

DNA supercoiling around TSSs and regulatory elements. (a) Graph showing bTMP binding, indicative of DNA supercoiling, +/− 20 kb around transcription start sites (TSSs) in the presence or absence of bleomycin for active and inactive genes. (b) Profiles showing the changes in DNA supercoiling around TSSs after inhibiting RNA polymerases and topoisomerases. (c) Graph showing distribution of DNA supercoiling +/−5 kb of DNaseI sensitive sites before and after transcription inhibition. (d) Profile of DNA supercoiling +/− 10 kb around CTCF and p300-CBP binding sites. CTCF binding sites for RPE1 cells were obtained from the ENCODE project. p300-CBP binding sites are for A549 cells from the ENCODE project. (e) Graph showing topoisomerase binding +/− 20 kb around CTCF binding sites as determined by ChIP-microarray. T-tests were used to show the peak signal was significantly different to randomly generated background data, P < 2.2 × 10⁻¹⁶.
