Figure 6.

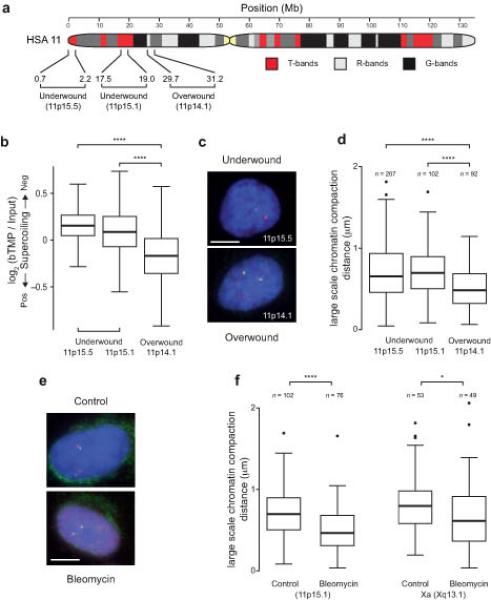
Under-wound domains are cytologically decondensed and torsionally constrained. (a) Ideogram of human (HSA) chromosome 11 showing T-bands, R-bands, G-bands and probe positions at the under and over-wound 1.5 Mb chromosomal loci studied. (b) Boxplot showing the DNA supercoiling at the under-wound 11p15.5 and 15.1 loci and at the over-wound 11p14.1 loci, as measured by bTMP binding. (c) Representative images showing 3D DNA FISH of pairs of labeled fosmid probes (red and green spots) positioned 1.5 Mb apart either side of the loci to measure large-scale chromatin compaction. Nuclei are counterstained with DAPI. Bar is 5 μm. (d) Boxplots showing the distance between pairs of fosmid probes as a measure of chromatin compaction at under-wound and over-wound genomic loci. (e) Representative images showing 3D DNA FISH of pairs of labeled fosmid probes (red and green spots) positioned 1.5 Mb apart at 11p15.1 in the presence and absence of bleomycin. Nuclei are counterstained with DAPI. Bar is 5 μm. (f) Boxplot showing the change in large-scale chromatin compaction at the 11p15.1 and Xq13.1 loci after treatment with bleomycin. Boxplots are as described in Fig. 4 and asterisks correspond to P-values determined by Wilcoxon test, also as described in Fig. 4. n is the number of separate probe pairs examined.
