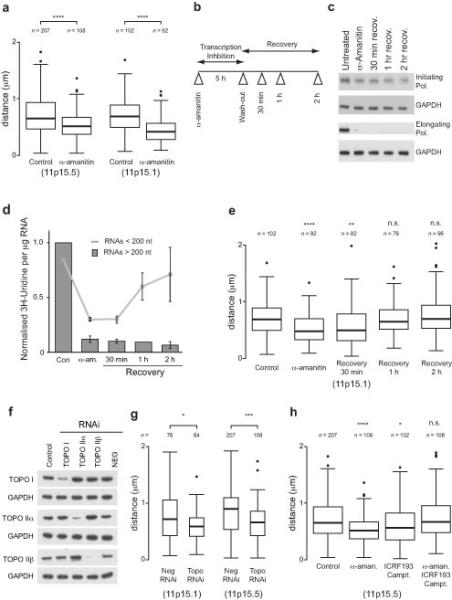
Figure 7.

Transcription and topoisomerase dependence of large-scale chromatin structures. (a) Boxplot showing the change in large-scale chromatin compaction using 3D DNA FISH at the 11p15.5 and 11p15.1 loci after 5 hrs α-amanitin treatment to inhibit transcription. (b) Schematic showing the experimental approach used to investigate changes in chromatin structure after transcription inhibition and recovery. (c) Western blot showing the global levels of RNA polymerase using antibodies against differently activated forms of the polymerase after transcription inhibition. GAPDH is shown as a loading control. (d) Graph showing incorporation of 3H-Uridine into short (< 200 nt) and long (> 200 nt) RNA after 30 min pulse labeling to measure RNA synthesis after inhibition of transcription by α-amanitin followed by recovery. Error bars are s.d. (n = 3). (e) Boxplots showing the compaction of the 11p15.1 locus after transcription inhibition and drug washout. (f) Western blot showing the loss of topoisomerase (topo) I and II proteins after topoisomerase RNAi. GAPDH is shown as a loading control. (g) Boxplot showing distance between pairs of fosmid probes at 11p15.1 and 11p15.5 loci after topoisomerase RNAi (Neg., negative; topo, topoisomerase). (h) Boxplot showing distance between pairs of fosmid probes at the 11p15.1 locus after transcription inhibition by α-amanitin in the presence or absence of topoisomerase inhibitors, ICRF193 or camptothecin. Boxplots are as described in Fig. 4 and asterisks correspond to P-values determined by Wilcoxon test, also as described in Fig. 4. n = the number of separate probe pairs examined. In panels (e) and (h), P-values are calculated compared to control.
