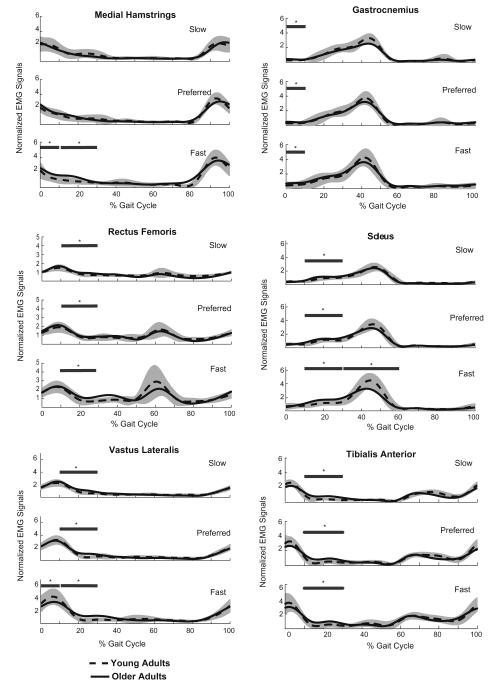
Fig. 1.
Ensemble averaged electromyographic activities for the young and older adults at the slow, preferred and fast walking speeds. The shaded portion represents plus and minus one standard deviation of the young adults’ data. The horizontal lines above the curves indicate phases of the gait cycle where the average normalized activities over a phase of the gait cycle differed significantly (*p < 0.05) between the age groups, as determined by Tukey’s post hoc tests. The phases of the gait cycle that were statistically compared for each muscle are given in Table 3.

