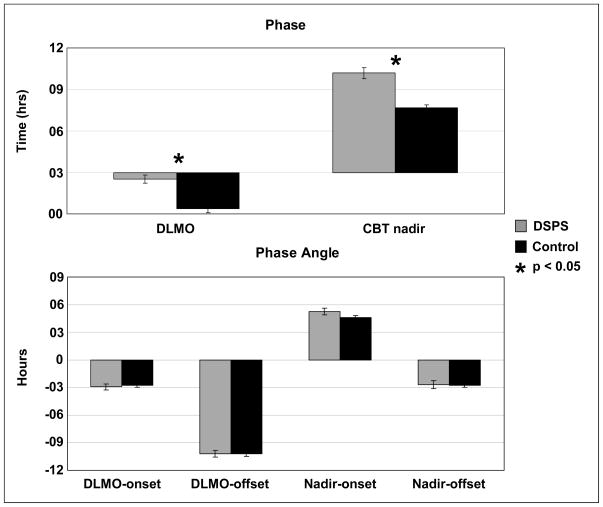
Figure 3.
Comparison of circadian phase and phase angle measures between DSPS and control groups. Mean times of 2 circadian phase markers, dim-light melatonin onset (DLMO), and core body temperature (CBT) nadir, are shown in the top panel. Four phase angle measures were calculated as the difference between a phase measure, DLMO or CBT nadir, and a sleep measure, sleep onset or offset, and are shown in the bottom panel. SE bars are shown.

