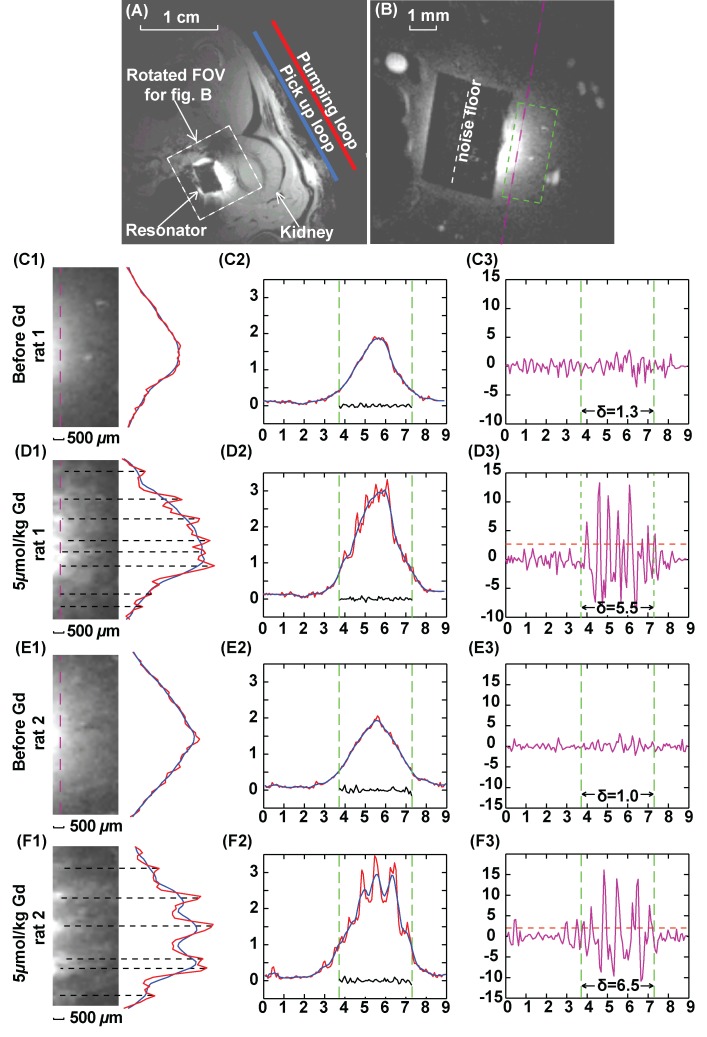
Figure 3:
Axial T1-weighted GRE images of rat kidney. A, Low-spatial-resolution image acquired without parametric amplification (357/6, 30° flip angle, one signal acquired, 156 × 156 μm2 in-plane resolution, 4 × 4 cm2 FOV, 1 mm section thickness). B, High-spatial-resolution image, with FOV defined by the white dashed box in A (37.4/3.6, 40° flip angle, 70 × 70 μm2 in-plane resolution, 9 × 9 mm2 FOV, 0.2 mm section thickness, 40 signals acquired; experiment time, 3.2 min). The black rectangular region in the center of B is the PDMS-coated resonator. C–F, Column 1 shows 1.5 × 3.5 mm2 region of interest defined by green dashed box in B and positioned 0.5 mm from the edge of the resonator. Column 2 shows one-dimensional intensity profiles along the pink dashed line in B with an extended width of 9 mm. Red = unsmoothed profile, blue = smoothed profile. Smoothing was done by averaging image intensity over seven adjacent pixels. Green dashed line = edges of the resonator. Noise plotted within the green lines is taken along the white dashed line in B through the center of the coated resonator where there is little background signal. Column 3 shows DNR for each one-dimensional profile, obtained by dividing the difference between image intensity for each pixel and the local average with the standard deviation of noise floor defined in B. For each plot, horizontal axis is in millimeters and vertical axis is a dimensionless unit. Standard deviation of DNR is evaluated within the region of interest defined by the green dashed line. Threshold (dashed orange) lines for peak identification in D3 and F3 are defined by twice the standard deviation of DNR in C3 and E3, respectively. Peaks above the threshold lines in D3 and F3 are labeled by black dashed lines in D1 and F1.

